
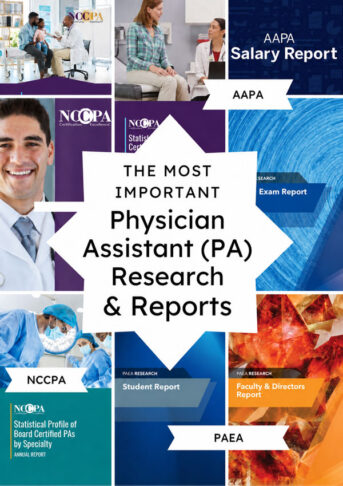
Every number you have ever read about PA school, PA salaries, or the PA job market traces back to about twenty reports. Here they all are — the newest edition of each, what it actually says, and whether it is still worth citing.
Here is something nobody tells you: a lot of the PA data floating around the internet is years out of date, and the people repeating it have no idea.
That “20% job growth” number in every article you have read? It comes from a Bureau of Labor Statistics page that is rewritten on a fixed schedule almost nobody checks. The PANRE pass rate that blogs quote as current? It is from the 2018 recertification cohort. The tuition averages in half the PA school listicles? PAEA collected those in 2021 and has not published a Program Report since.
I got tired of chasing this down every time I updated an article, so I built the thing I wanted for myself: one page with every recurring report on the PA profession, the current edition of each, what is inside it, and an honest flag on the ones that have gone stale.
Everything below was checked against the publisher’s own PDF or page. Nothing is quoted from another blog.
The PA research library: every major report, and whether it is still current
Twenty-one recurring data sources on the PA profession — who publishes them, what is inside, what the newest edition actually says, and when the next one drops. Six of them are badly out of date, and a great deal of what you read online is quoting those six.
Before you cite anything: NCCPA publishes two profiles, and they are not interchangeable
The Statistical Profile of Board Certified PAs covers all 201,038 of us. The Statistical Profile of Recently Board Certified PAs covers only the class that got certified last year. Their numbers look similar and mean completely different things.
Mean income in the all‑PA report is $134,010. Quote that as a new graduate’s starting salary and you are off by roughly $20,000. Same trap with debt: 43.3% of all PAs report no education debt, because most of us pay it off over a career — new grads report a median of $137,500. This is the single most common error in PA salary coverage, and I have made it myself.
When the new data actually drops
PA data is seasonal. If you are writing, negotiating, or applying, here is the release calendar for the year.
- NCCPA Profile by State
- NCCPA PANCE pass rates
- ARC-PA winter actions
- NCCPA all-PA Statistical Profile
- AAPA Salary Report
- BLS OEWS wage estimates
- Medscape PA compensation
- BLS projections + OOH, Aug 27
- NCCPA Profile by Specialty
- AMN recruiting incentives
- ARC-PA fall actions
- APPAP fellowship conference
- NCCPA Recently Certified PAs
- HRSA workforce projections
- PAEA reports, when they come
- ARC-PA accredited list
- CASPA program directory
- PA Licensure Compact map
Statistical Profile of Board Certified PAs
The census of the whole profession: how many PAs there are, where they work, what they earn, what specialty they sit in, and how many are thinking about leaving.
- 201,038 board certified PAs at the end of 2025 — the first time the profession has crossed 200,000, and up 26.9% since 2021.
- Mean total income from PA work $134,010, median $125,000 — total income, not base salary (mean was $117,381 in 2021).
- Primary care is still the single largest practice area at 21.4%, followed by surgical subspecialties at 18.3%.
- 93.5% of PAs practice in urban settings; 1.2% in isolated rural areas.
Statistical Profile of Recently Board Certified PAs
The new-graduate report. If you want to know what your first job, first salary, and first loan payment will actually look like, this is the one — not the all-PA profile.
- 12,400 PAs earned certification for the first time in 2024 — a record, and about 25% above 2020.
- Median education debt $137,500; 12.4% graduated with none at all.
- Among new grads who accepted a job, 77.7% had multiple offers; average search was 2.6 months.
- Starting pay is reported in bands, not an average: 22.7% landed at $100,001–110,000 and 21.6% at $110,001–120,000.
Statistical Profile of Board Certified PAs by Specialty
Everything broken out by specialty: hours, patient mix, burnout, postgraduate training, and — new in the 2024 edition — compensation by gender within specialty.
- The 2025 PDF is not downloadable yet. NCCPA put the report page up on Aug 13, 2026 with no file attached. Figures below are from the 2024 edition until it lands.
- 2024 edition: 159,514 of 189,907 responded (84.0%), covering 24 specialties plus primary care.
- 5.7% of PAs have completed a postgraduate program — highest in critical care (16.5%) and emergency medicine (10.6%).
- Burnout rose in every single specialty between 2020 and 2024, worst in gastroenterology and emergency medicine.
Statistical Profile of Board Certified PAs by State
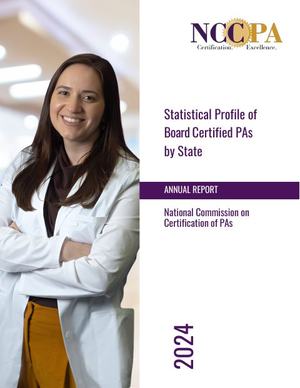
State-by-state tables: how many PAs, what they earn, how many are in primary care, telemedicine use, HPSA practice, and how many plan to retire.
- Among PAs working 40+ hours a week, male PAs earned an average of $17,177 more than female PAs nationally. Widest gap: Louisiana at $22,866. Narrowest: Vermont at $7,636.
- 5.8% of PAs nationally plan to retire within five years — 14.3% in Wyoming, 14.2% in Alaska.
- Fastest five-year growth: South Carolina 48%, Hawaii 41.3%, Arkansas 40.5%.
- Highest primary care concentration: Alaska 44.2%, North Dakota 41.6%, Wyoming 35.0%.
Five Year Pass Rates for PANCE
The only official national PANCE numbers: how many sat, how many passed, first-time versus repeat, mean scaled score.
- 2025: 13,145 first-time takers, 91.5% passed — the lowest first-time rate in the current five-year window.
- 12,963 PAs passed PANCE in 2025 across all attempts.
- Overall 2025 pass rate across all 14,669 exams: 88.4%. Mean scaled score 458.65.
- The passing scaled score is 350. A program's rate is not the national rate — don't compare them.
PANRE Pass Rates
The last public PANRE pass-rate table NCCPA published. There is no public PANRE-LA pass-rate report at all.
- This is seven years stale. If you see a blog quoting a "current" PANRE pass rate, it is quoting 2018 data.
- 2018 cohort: 9,454 PAs due to recertify, 9,243 took at least one PANRE, 8,996 (97%) passed on the first attempt, 99% passed eventually.
- PANRE passing score is 379. PANRE-LA is 1150.
- No PANRE-LA pass-rate publication exists publicly, despite PANRE-LA now being the route most PAs take.
AAPA Salary Report
The deepest compensation dataset in the profession — by specialty, state, setting, years of experience, and employment type. Fielded after W-2s land, on purpose.
- Median profession-wide compensation $140,000 for 2025, up from $134,000 in 2024 (+4.5%).
- This is total compensation, not base salary. The 2025 edition listed base separately at $130,000. Mixing them is the most common mistake in PA salary coverage.
- Median bonus $6,000; 58% of full-time PAs received one. Median $26 per RVU against a median 4,000 RVUs logged.
- Free to AAPA Fellow, Student, and Retired members. $275 for Pre-PA and Affiliate members. Nonmembers get a summary only.
Occupational Employment and Wage Statistics (OEWS), 29-1071
Federal wage and employment data by state and metro area. Employer-reported, so it is the best counterweight to self-reported salary surveys — but it counts wages only, not bonuses or benefits.
- Employment 162,150 PAs; median hourly $65.33; mean hourly $67.92; mean annual $141,280.
- The news release table publishes hourly wages plus the annual mean — but no annual median. BLS does publish one ($135,880) in the full OEWS data and in the Handbook, and it is estimated separately, not hourly × 2,080. If you ever derive an annual figure yourself, say so.
- The old
bls.gov/oes/current/oes291071.htmaddress is dead — BLS retired the static occupation pages. Use the news release table or the interactive profile. - OEWS wages exclude bonuses, on-call pay, and benefits, which is a chunk of why AAPA's number runs higher.
Occupational Outlook Handbook — Physician Assistants
The source of every "PA jobs are growing 21%" headline you have ever read, plus the official median pay figure most news outlets quote.
- Median pay is $135,880 per year ($65.33 per hour) as of May 2025 — up from $133,260 in May 2024.
- Employment is projected to grow 21% from 2025 to 2035, "much faster than average" for all occupations.
- 168,900 PAs were employed in 2025; BLS projects 35,700 more by 2035.
- About 11,500 PA openings are projected each year, on average, over the decade.
By the Numbers: Program Report
Program operations and finances: tuition, fees, budgets, class size, faculty ratios, regional distribution. The only national source for what programs actually charge and spend.
- This is the most overdue report in the profession. PAEA has fielded the 2022, 2023, and 2025 Program Surveys and published none of them.
- Average total professional-phase tuition: $100,212 private vs $57,955 public resident — in 2021 dollars.
- 64.7% of programs paid for some or all clinical rotations, a number that has been climbing for years.
- 82.8% of the average program budget came from the sponsoring institution. Programs are cost centers, not profit centers, more often than people assume.
By the Numbers: Student Report
Who actually gets in and what happens to them: GPA, age, hours, debt, motivation, and specialty preference at graduation. This is the closest thing to a national matriculant profile.
- URiM matriculants rose to 27.4% in 2022, up from 14.0% in 2020 — the biggest good-news number in PA education right now.
- Matriculants: 79.0% female, mean age 25.2, mean undergraduate GPA 3.6.
- 96.1% had prior healthcare employment. Mean direct patient care was 4,994 hours — but the standard deviation is 8,441, so that mean is badly skewed. Don't read it as typical.
- 78.4% borrowed for PA school, most commonly $100,000–$124,999.
By the Numbers: Curriculum Report
What programs require to apply. Note the method: PAEA read program websites rather than surveying, so it is not strictly comparable to earlier editions.
- Required by nearly everyone: anatomy 97.4%, physiology 97.4%, microbiology 89.4%, statistics 80.8%.
- Chemistry is less universal than pre-PAs assume: general chem 61.5%, organic chem 60.4%, biochem 56.2%.
- Only 22.0% of programs required PA shadowing. Direct patient care was required by 67.4%.
- GRE required by 52.2% as of 2021 — and that share has been falling fast since, so treat it as a ceiling.
By the Numbers: Faculty & Directors Report
For PAs considering academia: faculty and program director salaries, demographics, workload, clinical practice, and satisfaction.
- Faculty mean salary $105,353 (median $103,000). Program directors mean $141,964 (median $136,000).
- 58.5% of faculty still practice clinically, averaging 11.3 hours a week.
- Faculty are 69.6% female and 85.5% White; underrepresented minorities make up 14.2% of faculty and 11.8% of program directors.
- 68.3% of faculty reported satisfaction with their position — and the low 23.3% response rate means read that with care.
Currently Accredited PA Programs
The only authority on whether a program is accredited, and at what status — Continued, Provisional, or Probation. Check it before you apply anywhere. Check it again before you accept a seat.
- Watch the count. ARC-PA's page says 335 programs in a hand-typed sentence, and its own table lists 334 sponsoring institutions. Our weekly audit at PA School Finder counts 356 accredited program records: 262 Continued, 59 Provisional, 35 Probation — higher because distant campuses get their own rows.
- Probation is public and it matters. ARC-PA's table shows 31 programs on it (35 in our count, which separates distant campuses). ARC-PA posts the actions; almost nobody reads them.
- Provisional is normal for a new program and is not a red flag by itself — but it does mean the program has never graduated a class under full review.
- Accreditation actions are posted after each commission meeting, roughly January, April, and September.
Medscape Physician Assistant Compensation Report
A second compensation read with a different sample and different method. Useful as a cross-check on AAPA, not as a replacement.
- Average total compensation $149,000 (up from $142,000); average base pay $135,000; average bonus $8,000.
- Medscape reports means. AAPA reports medians. That alone explains most of the $9,000 gap between them — they are not contradicting each other.
- Reported gender gap: women $143,000 vs men $161,000.
- Neither the respondent count nor the field dates are published, which is the main reason to treat this as supporting evidence rather than primary.
State of the Primary Care Workforce
The federal projection of how many primary care PAs the country will have versus how many it needs. The one place PAs are modeled as a supply variable rather than counted after the fact.
- 29,433 PAs were working in primary care in 2024.
- HRSA projects a surplus of 6,660 full-time-equivalent primary care PAs by 2038 — while projecting a physician shortage over the same window.
- That combination is the entire policy argument for scope-of-practice reform, and it comes from the government's own model.
- A companion report, State of the U.S. Health Care Workforce 2025, counts 163,268 PAs from Census data — a different number than NCCPA's because it counts employment, not certification.
CASPA Program Directory
PAEA's searchable directory of programs, filterable by state, degree, GPA and hours requirements, and start month. Since PAEA's PDF reports are years behind, this is often more current than its own research.
- Filterable by the things that actually knock people out: minimum GPA, required healthcare hours, start month, degree awarded.
- This is the same source PAEA used to build Curriculum Report 6 — so the directory is the underlying data, not a summary of it.
- Free and public. No membership needed.
- Cross-check anything you find here against ARC-PA for accreditation status and against the program's own site for the current cycle.
Statistical Profile of APRN and PA Residency/Fellowship Programs
The only descriptive data on postgraduate PA residency and fellowship programs and the people who direct them.
- Labeled 2025, built on 2023 data collected at a conference. Do not cite it as a current picture of the fellowship landscape.
- The sample is conference attendees, not a census of programs — it skews toward engaged, established programs.
- For context on how many PAs actually do this: NCCPA found 5.7% of certified PAs have completed a postgraduate program.
- APPAP's research hub itself is active, with a monthly research workgroup and a curated literature list.
Review of Physician and Advanced Practitioner Recruiting Incentives
What employers actually offered during live searches — starting salaries, signing bonuses, relocation, loan forgiveness. Recruiter data, so it reflects the offer, not the eventual paycheck.
- For the sixth year running, nurse practitioners were the most-requested search. PAs are still not broken out on the public page — they’re folded into "advanced practitioners."
- Average physician starting salary $419,000 (2025 edition: $403,000); gastroenterology highest at $654,000. These are averages, and the page doesn’t say whether they’re base or total.
- Signing bonuses appeared in 87% of all engagements; the physician average rose to $49,306 from $38,215. No APP-specific bonus is published on the page this year.
- Recruiter data systematically overstates what a typical PA earns, because these are competitive searches in hard-to-fill markets.
PA Licensure Compact — enactment tracker
Not a research report, but the single most consequential thing on this list for practicing PAs. One privilege, multiple states, instead of a license application per state.
- 29 states have enacted the compact. Zero privileges have been issued yet.
- The commission expects to begin issuing privileges in early 2027 — so if you are planning locums or a multi-state telehealth role, this is the date to watch.
- Enactment is not participation. A state can pass the law and still take a year to stand up the data connection.
- Check your own state before you assume anything; the map moves every legislative session.
Provider Compensation and Productivity Data Report
What medical group practices actually pay, tied to productivity. This is the dataset your employer's administrator is negotiating from — which is exactly why it is worth knowing it exists.
- Gated. Free to MGMA members and DataDive customers, form-required otherwise. No PA figures are published publicly.
- MGMA reports medians by role, tied to work RVUs — the same currency most PA productivity bonuses are written in.
- Notable from the 2026 edition: compensation rose modestly while wRVUs fell in 16 of 23 specialties.
- If you are negotiating an RVU-based contract, ask your employer which benchmark and which percentile they are using. They have this report. You should know that.
How to read any of these without getting fooled
Check the data year, not the edition year. A report published in 2026 can be built on 2021 numbers. PAEA’s Program Report says 2024 on the cover and is reporting 2021 tuition.
Median and mean are not the same story. AAPA reports medians, Medscape reports means, and the $9,000 gap between them is mostly arithmetic, not disagreement.
Watch the denominator. A 23% response rate from faculty and an 84% response rate from certified PAs do not deserve equal confidence, even in the same sentence.
Ask who was counted. BLS counts jobs, NCCPA counts certifications, HRSA counts census respondents. Three different PA totals, all correct.
Which report should I actually read?
Twenty-one sources is a lot. Here is how I would narrow it down.
If you are applying to PA school, start with PAEA’s Student Report 6 for the matriculant profile, then check ARC-PA’s accreditation actions before you fall in love with a program. Thirty-one programs are on probation right now — 35 records once distant campuses are counted separately. That is public information, and almost nobody looks it up. Our own breakdown of who actually gets in pulls from the same report if you want it in plain English.
If you are a PA student staring down boards, the NCCPA five-year table is the only official national PANCE pass rate there is. Your program’s rate is not the national rate. Comparing the two will either scare you for no reason or reassure you for the wrong one.
If you are negotiating a contract, you want three sources, not one: the AAPA Salary Report for the median, MGMA for the RVU benchmark your administrator is quoting at you, and BLS OEWS as the employer-reported sanity check. They will give you three different numbers and all three will be correct. Our cost-of-living-adjusted salary data is the fourth read I would add.
If you are writing about the profession — and more of you are than you think — please look at the data year before you hit publish. Not the year on the cover. The year the numbers were collected.
What do I do when the report I need is stale?
This happens more often than it should. Four of PAEA’s report series are overdue. NCCPA has not touched PANRE pass rates in seven years. Medscape skipped 2026 entirely, so far.
When that happens, here is what I do:
- Say the data year out loud. “According to PAEA’s 2021 program survey” is honest. “According to PAEA” is not, when the numbers are five years old and tuition has moved.
- Go to the primary source underneath the report. ARC-PA posts accreditation actions three times a year whether or not anybody summarizes them. Programs publish their own tuition. The data usually exists — it just has not been packaged.
- Build it yourself if it matters enough. That is exactly why we re-verify all 356 accredited program records every week on PA School Finder instead of waiting on a report that may never come. When ARC-PA’s own page says 335 (its table lists 334) and our weekly count says 356, that gap is the whole argument for checking.
What changes next, and when
PA data is seasonal, and the release calendar in the library above always flags whichever month is coming up next. Three dates are worth putting in your own calendar:
- Late August 2027. BLS releases its next round of employment projections and rewrites the Occupational Outlook Handbook. Every “21% growth” and “$135,880 median” citation on the internet goes stale that morning, including a few of mine. BLS has not announced the exact date; it has landed on the last Thursday of August two years running.
- Fall 2026. NCCPA’s new-graduate profile lands — the one that tells you what starting salaries and student debt actually look like this year.
- Early 2027. The PA Licensure Compact is expected to start issuing privileges. Twenty-nine states have enacted it and not one privilege has been issued yet. If you are planning locums or multi-state telehealth, watch this one.
The status flags in the library check themselves against those dates every time the page loads, so a report that slips past its due date starts saying so on its own. I re-check the publishers each month and refresh whatever has actually changed. That is the whole point of the page.
Want the numbers instead of the sources?
This page is the library. If what you actually want is the data itself — salary charts, program counts, state-by-state tables, the demographics of the profession — that lives next door in The PA Profession by the Numbers, where we keep it visualized and updated.
And if you are earlier in the journey than any of this, start with the getting started guide. The reports will still be here when you need them.
Bookmark this page. I will do the checking so you do not have to.
Thanks for reading — I am rooting for you.
Stephen Pasquini, PA-C
You may also like -
 Has AI Replaced the Supervising Physician?I consult AI almost every clinical day. It is available 24/7, never judges, and helps me improve patient care—but it can also be confidently wrong. Has it replaced the supervising physician? Not even close.
- How Much Money Do Physician Assistants (PAs) Make?How much do physician assistants make in 2026? The latest AAPA, BLS & NCCPA data: $140K median pay, top-paying specialties, all 50 states. Know your worth.
- The Perfect PA Program Picker: PA School Search, Sort, Match, and ApplyChoosing where to apply is one of the highest-stakes decisions of your pre-PA journey — and the data you use should never be out of date. The Program Picker below is powered by the live PA School Finder verified directory: every […]


CASPA Personal Statement Help
 We offer comprehensive, start-to-finish personal statement assistance or help to perfect a draft you already have. We have services to fit every budget.
 Schedule a Live Recorded PA School Video Interview

We offer 60-minute mock PA school interviews with post-interview feedback and advice. Includes a recorded video of your interview that you can watch, download, or share with family and friends. There is no better way to prepare!
Schedule an InterviewPre-PA Consulting and Advising
 Our pre-PA coaching service consists of a 1-hour phone consultation focused on addressing your specific questions or concerns about becoming a PA and applying to PA school.


Leave a Reply