 How Much Do PAs Make in 2026?

"We make a living by what we get, we make a life by what we give." - Winston Churchill
Physician Assistant/Associate Salary and Compensation
According to the 2026 AAPA Salary Report — the most comprehensive PA compensation survey available — the national median compensation for full-time PAs hit $140,000 per year in 2025, a 4.5% raise over the $134,000 median the year before. More than 58% of PAs also took home a bonus (median: $6,000).
Live snapshot (Jul 31, 2026): U.S. median PA pay is $135,880 (May 2025 OEWS, employer-reported). Highest-paying state: New Jersey at $165,690. Adjusted for cost of living, Oklahoma leads — its median is worth $155,448 in national buying power.
PA salary by state — nominal and cost-of-living adjusted (May 2025 OEWS)
| Rank | State | Median salary | Hourly | Adjusted for cost of living (RPP 2024) | Adjusted rank |
|---|---|---|---|---|---|
| 1 | New Jersey | $165,690 | $79.66 | $152,282 | 5 |
| 2 | California | $165,650 | $79.64 | $149,612 | 10 |
| 3 | Washington | $164,360 | $79.02 | $153,589 | 3 |
| 4 | Hawaii | $164,050 | $78.87 | $149,203 | 12 |
| 5 | New York | $160,880 | $77.35 | $149,072 | 13 |
| 6 | Oregon | $155,780 | $74.89 | $150,714 | 7 |
| 7 | New Hampshire | $150,960 | $72.58 | $144,924 | 19 |
| 8 | Alaska | $150,700 | $72.45 | $147,227 | 16 |
| 9 | Vermont | $150,490 | $72.35 | $153,627 | 2 |
| 10 | Massachusetts | $142,410 | $68.47 | $134,658 | 37 |
| 11 | Montana | $141,470 | $68.01 | $149,474 | 11 |
| 12 | Minnesota | $141,190 | $67.88 | $143,164 | 21 |
| 13 | Rhode Island | $139,930 | $67.27 | $136,811 | 30 |
| 14 | New Mexico | $139,920 | $67.27 | $151,737 | 6 |
| 15 | Connecticut | $139,860 | $67.24 | $134,987 | 35 |
| 16 | Delaware | $139,350 | $67.00 | $139,618 | 26 |
| 17 | Maryland | $137,560 | $66.13 | $131,061 | 42 |
| 18 | Oklahoma | $136,550 | $65.65 | $155,448 | 1 |
| 19 | Wyoming | $136,080 | $65.42 | $146,810 | 17 |
| 20 | Virginia | $135,940 | $65.36 | $134,456 | 38 |
| 21 | District of Columbia | $135,140 | $64.97 | $122,965 | 48 |
| 22 | Missouri | $135,130 | $64.97 | $148,794 | 14 |
| 23 | Iowa | $134,770 | $64.79 | $153,563 | 4 |
| 24 | Utah | $134,740 | $64.78 | $136,288 | 32 |
| 25 | Nevada | $134,660 | $64.74 | $134,688 | 36 |
| 26 | Arizona | $134,650 | $64.74 | $133,745 | 40 |
| 27 | Texas | $134,550 | $64.69 | $138,630 | 28 |
| 28 | Colorado | $134,540 | $64.68 | $130,555 | 44 |
| 29 | Wisconsin | $133,950 | $64.40 | $142,356 | 23 |
| 30 | Idaho | $133,790 | $64.32 | $140,103 | 25 |
| 31 | North Dakota | $133,450 | $64.16 | $150,013 | 9 |
| 32 | South Dakota | $133,200 | $64.04 | $150,362 | 8 |
| 33 | Nebraska | $133,040 | $63.96 | $147,653 | 15 |
| 34 | Ohio | $132,090 | $63.50 | $142,378 | 22 |
| 35 | Indiana | $132,050 | $63.49 | $141,489 | 24 |
| 36 | Illinois | $131,950 | $63.44 | $132,005 | 41 |
| 37 | Michigan | $131,510 | $63.23 | $136,681 | 31 |
| 38 | Maine | $131,170 | $63.06 | $135,157 | 34 |
| 39 | Florida | $129,620 | $62.32 | $125,341 | 47 |
| 40 | North Carolina | $129,360 | $62.19 | $137,141 | 29 |
| 41 | Louisiana | $128,870 | $61.96 | $146,100 | 18 |
| 42 | West Virginia | $128,610 | $61.83 | $143,703 | 20 |
| 43 | Pennsylvania | $127,070 | $61.09 | $130,232 | 45 |
| 44 | Kansas | $125,640 | $60.40 | $139,495 | 27 |
| 45 | South Carolina | $122,490 | $58.89 | $130,657 | 43 |
| 46 | Kentucky | $120,760 | $58.06 | $133,941 | 39 |
| 47 | Arkansas | $118,430 | $56.94 | $136,225 | 33 |
| 48 | Tennessee | $118,240 | $56.85 | $128,704 | 46 |
| 49 | Georgia | $115,390 | $55.48 | $119,832 | 50 |
| 50 | Mississippi | $105,920 | $50.92 | $121,813 | 49 |
| 51 | Alabama | $104,960 | $50.46 | $118,168 | 51 |
Highest-paying metros for PAs
| Metro | Median salary | Adjusted for cost of living |
|---|---|---|
| San Jose-Sunnyvale-Santa Clara, CA | $223,640 | $202,530 |
| San Francisco-Oakland-Fremont, CA | $184,380 | $159,480 |
| New York-Newark-Jersey City, NY-NJ | $167,650 | $148,939 |
| Seattle-Tacoma-Bellevue, WA | $167,290 | $150,531 |
| Riverside-San Bernardino-Ontario, CA | $165,490 | $155,474 |
| San Diego-Chula Vista-Carlsbad, CA | $165,160 | $147,613 |
| Portland-Vancouver-Hillsboro, OR-WA | $163,810 | $155,386 |
| Los Angeles-Long Beach-Anaheim, CA | $161,890 | $142,551 |
| Sacramento-Roseville-Folsom, CA | $161,470 | $151,373 |
| Santa Cruz-Watsonville, CA | $159,030 | $144,710 |
| Washington-Arlington-Alexandria, DC-VA-MD-WV | $148,200 | $136,108 |
| Minneapolis-St. Paul-Bloomington, MN-WI | $145,030 | $138,358 |
| Boston-Cambridge-Newton, MA-NH | $142,410 | $131,537 |
| San Antonio-New Braunfels, TX | $140,160 | $147,979 |
| Providence-Warwick, RI-MA | $139,930 | $137,492 |
| Oklahoma City, OK | $138,920 | $153,659 |
| Baltimore-Columbia-Towson, MD | $138,790 | $132,830 |
| Hartford-West Hartford-East Hartford, CT | $138,680 | $134,974 |
| Columbus, OH | $137,550 | $144,078 |
| Houston-Pasadena-The Woodlands, TX | $137,240 | $139,148 |
| St. Louis, MO-IL | $136,120 | $143,152 |
| Cleveland, OH | $135,860 | $144,650 |
| Philadelphia-Camden-Wilmington, PA-NJ-DE-MD | $135,640 | $132,262 |
| Milwaukee-Waukesha, WI | $135,040 | $139,307 |
| Dallas-Fort Worth-Arlington, TX | $134,900 | $130,857 |
Sources: U.S. Bureau of Labor Statistics OEWS (occupation 29-1071, employer-reported), cost-of-living adjustment via U.S. Bureau of Economic Analysis Regional Price Parities. Adjusted value = median ÷ RPP × 100. Updated automatically.
A median pay of $140,000 per year works out to roughly $11,667/month, $2,692/week, or $67.31/hour (annualized). To put that in perspective: the median U.S. worker earns $50,980 (BLS, May 2025) — so the typical PA earns about 2.7 times the median American salary.
According to the brand-new latest NCCPA Statistical Profile (the 2025 Statistical Profile of Board Certified PAs), the median total income of certified PAs is $125,000 per year, with a mean of $134,010 — up 14.2% over the last five years. The NCCPA figure runs lower than AAPA’s median because it casts the widest possible net: total income from all certified PAs, including part-time and newly certified practitioners. (A milestone worth celebrating from the same report: the profession passed 200,000 board certified PAs for the first time in 2025 — 201,038 of us and counting!)
The highest-paid PAs (per the AAPA 2025 report — still the most recent specialty-level breakdown) work in cardiovascular/cardiothoracic surgery, with a median base compensation of $162,914 per year. Dermatology PAs have the most extraordinary earning upside, with a median bonus of $21,000 and a 90th-percentile base salary of $290,000 — making top-earning derm PAs among the highest-compensated advanced practice providers in medicine.
More than 58% of full-time PAs received a bonus in 2025, with a median bonus of $6,000 (AAPA 2026). Here’s an insight worth pausing on: the median bonus actually shrank (it was $7,500 the year before) while base pay jumped 4.5% — employers are moving money out of discretionary bonuses and into guaranteed salary. When you negotiate, negotiate the base. The vast majority of PAs (83%) are salaried, 14% are paid hourly, and 3% are paid on productivity — where the median rate is $26 per RVU on a median of 4,000 RVUs logged per year.
On average, family medicine PAs make $125,000 per year, emergency medicine PAs make $146,000 per year, and an orthopedic surgery PA can expect to make $135,000 per year (all figures: AAPA 2025, median base compensation).
The Bureau of Labor Statistics (BLS) reports the median salary for PAs at $135,880/year or $65.33 per hour (May 2025) — up 2.0% from $133,260 in May 2024 — with the top 10% earning $190,280/year or more. Employment of physician assistants is projected to grow 20 percent from 2024 to 2034, much faster than the average for all occupations, with approximately 12,000 openings projected each year.
As of February 2026, the average annual pay for a physician assistant in the United States, according to data from ZipRecruiter, is $120,212 a year or approximately $58 per hour. Most PA salaries currently range between $100,000 (25th percentile) and $135,500 (75th percentile) across the United States.
The median salary for recently certified, new-graduate PAs is approximately $118,000 per year (AAPA 2025, PAs with 0–1 years of experience) — and NCCPA’s 2025 profile pegs first-year PAs at a $115,000 median, so the two reports agree: expect roughly $115–118K your first year. PAs who receive an hourly wage earn a median of $72/hour (part-time) to $75/hour (full-time). If you are paid hourly without benefits — per diem, extra help, or 1099 — a raw hourly comparison will flatter your rate: check whether it is actually fair with our PA hourly rate calculator.
Only 10% of PAs work part-time (fewer than 32 hours per week). PAs who work in emergency medicine, urgent care, or as independent contractors are more likely to receive an hourly wage.
Compare this to the average annual salary of a primary care physician of ~$287,000 or an emergency room physician of ~$350,000+ in 2025 (Medscape 2025 Physician Compensation Report).
Jobs Related to Physician Assistant
- Nurse Anesthetist (CRNA) — Median Salary $236,590 (BLS, May 2025)
- Nurse Practitioner (NP) — Median Salary $132,300 (BLS, May 2025) — the median PA now edges out the median NP
- Physician — Average Salary $287,000 (primary care); $404,000 (specialist)
- Registered Nurse — Median Salary $97,550 (BLS, May 2025)
Most PAs Receive Additional Non-Salary Benefits:
In addition to their base salary, most PAs receive additional non-salary benefits:
- More than 58% of full-time PAs receive a bonus, with a median bonus of $6,000 (AAPA 2026) — down from $7,500 the year before as employers shift compensation into base salary.
- Almost all PAs (87%) receive professional development compensation from their primary employer — a median of $2,200 per year (AAPA 2026). This covers things like DEA license reimbursement, CME expenses, credentialing fees, and professional dues.
- Most full-time PAs continue to have individual health, dental, and liability insurance included as a covered benefit.
- The majority of employers match between 3–7% of 401K contributions.
PA salaries — and the buying power of those salaries — vary enormously by state, and this is where most salary articles stop short. The nominal top payers (BLS, May 2025) are New Jersey ($165,690), California ($165,650), Washington ($164,360), Hawaii ($164,050), and New York ($160,880). But adjust for what a dollar actually buys (using the federal government’s Regional Price Parities), and the leaderboard flips: Oklahoma is #1 — its $136,550 median is worth $155,448 in real buying power — followed by Vermont, Washington, Iowa, and New Jersey. Washington is the unicorn: top five on both lists. Flip the “Adjusted for cost of living” toggle in the live table above to see where your state lands, or read the full deep dive in our PA salary adjusted for cost of living guide.
What is the Best PA Salary Report?
Multiple organizations report the salary of physician assistants; however, each PA salary report varies with how the data is gathered and what salary data is included.
The AAPA 2026 Salary Report (200+ pages of specialty, setting, and benefits detail) and the NCCPA Statistical Report (the majority of all certified PAs) are the most reliable. The AAPA report wins on depth and detail — specialty, region, setting, experience, and benefits — while the NCCPA report wins on sample size and is free to everyone.
What is the median PA salary in 2026? The four most reliable reports compared:
- AAPA 2026 Salary Report: Median compensation $140,000/yr (calendar-year 2025 data) — up 4.5% from $134,000 the year before
- NCCPA Statistical Report: $125,000/yr median · $134,010 mean total income (2025 Statistical Profile; free to everyone)
- Bureau of Labor Statistics (BLS): $135,880/year or $65.33/hour median (May 2025) ($133,260 in May 2024)
- ZipRecruiter: $120,212/year or ~$58/hour (February 2026)
*Consider the earning potential of locum tenens / travel PA positions, which typically pay 20–30% more than permanent positions, along with housing and travel stipends. Also see current inflation rates when projecting future salary growth.
Like a fine wine, PA salaries also get better with age
Years of experience matter significantly, with salary peaking for PAs with 15–19 years of experience at a median of $146,000 (AAPA 2025). PAs with 20 or more years of experience earn a median of $150,000 per year — more than $32,000 above what a new graduate earns. PAs with management responsibilities often earn an additional $10,000–$20,000 beyond clinical-only roles.
According to the AAPA 2025 Salary Report, median base compensation by years of experience is:
| Years of Experience | Median Base Compensation |
|---|---|
| 0–1 years (new graduate) | $118,000 |
| 2–4 years | $120,000 |
| 5–9 years | $131,000 |
| 10–14 years | $139,360 |
| 15–19 years | $146,000 |
| 20+ years | $150,000 |
PA compensation keeps climbing year over year: the 2026 AAPA report shows the median jumping 4.5% in 2025 (to $140,000), on top of a 5.5% rise the year before. That’s roughly a $13,000 raise for the median PA in just two years — comfortably ahead of inflation both years. Not bad for a profession that also keeps topping the best-jobs rankings.
Best-paying cities and metro areas for PAs
The live metro table above tracks 51 major U.S. metros, updated automatically from federal wage data. Right now San Jose–Sunnyvale–Santa Clara leads the nation at a $223,640 median — and here’s the kicker: even after adjusting for Silicon Valley prices, San Jose is still #1 in real buying power ($202,530 adjusted). San Francisco ($184,380), New York ($167,650), and Seattle ($167,290) round out the top nominal payers, while Oklahoma City and Portland sneak into the adjusted top five. (My own Santa Cruz–Watsonville metro pays a $159,030 median — worth about $144,710 after our coastal cost of living. A tough pill to swallow, but the beach helps. 🙂)
Physician Assistant Earnings by Part-time and Full-time Status (AAPA 2025)
| Earnings | 10th percentile | 25th percentile | 50th percentile (Median) | 75th percentile | 90th percentile |
| Part-Time (<32 hrs/wk) | |||||
| Base Salary | $64,000 | $77,000 | $100,000 | $125,000 | $150,000 |
| Base Hourly | $56 | $65 | $72 | $85 | $100 |
| Total Compensation | $54,600 | $70,387 | $94,770 | $121,000 | $149,760 |
| Bonus | $500 | $2,000 | $4,014 | $9,000 | $22,000 |
| Hours Worked/Week | 12 | 20 | 24 | 30 | 30 |
| Full-Time (32+ hrs/wk) | |||||
| Base Salary | $105,000 | $116,000 | $130,000 | $150,000 | $170,000 |
| Base Hourly | $57 | $65 | $75 | $85 | $100 |
| Total Compensation | $106,000 | $118,500 | $134,000 | $155,000 | $185,000 |
| Bonus | $1,000 | $3,000 | $7,500 | $15,000 | $34,000 |
| Hours Worked/Week | 34 | 38 | 40 | 45 | 50 |
PA Median Base Compensation by Specialty (AAPA)
Which PA specialties pay the most? Here are the top 10 highest-paying PA specialties — a short excerpt from the AAPA 2025 Salary Report (calendar-year 2024 data), which breaks down compensation across 45+ specialties. Figures are median base compensation from a PA’s primary employer; bonuses are reported separately.
| Specialty | Median Base Compensation | Median Bonus | 25th Percentile | 75th Percentile |
|---|---|---|---|---|
| 1. Cardiovascular/Cardiothoracic Surgery 🏆 | $162,914 | $10,000 | $145,000 | $195,700 |
| 2. Thoracic Surgery | $147,000 | $4,300 | $133,509 | $176,000 |
| 3. Emergency Medicine | $146,000 | $8,500 | $128,000 | $172,640 |
| 4. Vascular Surgery | $143,300 | $6,583 | $123,000 | $160,000 |
| 5. Anesthesiology | $143,120 | $2,000 | $117,000 | $159,120 |
| 6. Critical Care Medicine | $141,000 | $7,000 | $125,000 | $165,000 |
| 7. Dermatology ⭐ | $140,000 | $21,000 | $120,000 | $183,040 |
| 8. Occupational Medicine | $140,000 | $6,000 | $125,000 | $160,888 |
| 9. Oncology Surgery | $140,000 | $6,000 | $125,422 | $160,000 |
| 10. Radiology | $140,000 | $5,000 | $125,000 | $157,000 |
| National total (all specialties) | $134,000 | $7,500 | $118,500 | $155,000 |
A few things jump out. Surgery and acute care own the top of the list — seven of the ten are surgical or hospital-based specialties, and cardiovascular/cardiothoracic surgery leads the profession by a wide margin. Dermatology is the quiet overachiever: its $140,000 median base looks ordinary here, but derm PAs report a median bonus of $21,000 — nearly triple the national median — and top earners push past $290,000. And the spread matters: from ophthalmology at the bottom ($116,480) to CV surgery at the top is a difference of more than $46,000 a year, every year, for the same license. Here’s the best part — as a PA, you can move between these specialties without going back for a new residency — and PAs actually use that freedom: 52.7% have changed specialties at least once (NCCPA 2025). Your specialty choice is a compensation lever most other clinicians simply don’t have. (The full 45+ specialty breakdown, including bonuses and percentiles for every field, is in the AAPA Salary Report itself.)
Know Your Worth
The National Commission on Certification of Physician Assistants (NCCPA) Statistical Reports
- Includes the vast majority of all certified PAs in the U.S. — 201,038 board certified PAs as of the end of 2025, the first time the profession has topped 200,000
- FREE for everyone — the most accessible data source available
AAPA 2026 Salary and Compensation Report
- Thousands of PA respondents; 200+ pages of salary, benefits, and compensation data
- FREE to AAPA fellows, students, and retired members; $200 to non-members
Included in the AAPA annual report are the following:
- Median Base Salary and Bonus from Primary Employer by Work Setting and Years of Experience
- Professional Expenses Paid (DEA, NCCPA fees, AAPA membership, CME)
- Insurance Benefits and Retirement Benefits Provided by Primary Employer
- Paid Days Off; Call Status; Hours per Month on Call
- PA Compensation by Wage Type (annual salary, hourly, productivity pay)
- Median PA Salary by Region (West, Northwest, South, Midwest)
- Median Base Salary by Work Setting, Employer Type, and Major Specialty Area
- Cost-of-living adjusted median salary by state
Additional resources:
- Salary to hourly calculator
- Percentage increase calculator
- Inflation rate calculator
- AAPA 2026 Salary Report
- NCCPA Statistical Reports (free)
- BLS Physician Assistant Wage Data (free)
Recommended Reading:
You may also like -
 Scholarships, Grants and Loan Repayment Programs for Physician AssistantsPA School is Expensive
It goes without saying, PA school is expensive.
PA school is also demanding, which means you will have limited time (if any) to work while attending school.
With the average undergraduate education debt prior […]
Scholarships, Grants and Loan Repayment Programs for Physician AssistantsPA School is Expensive
It goes without saying, PA school is expensive.
PA school is also demanding, which means you will have limited time (if any) to work while attending school.
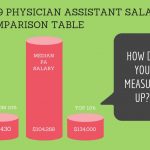
With the average undergraduate education debt prior […]- Physician Assistant Salary by State: 2019 Comparison Table
Click here to view the table.
What capital city should you move to if you want the highest median Physician Assistant salary in the United States?
I will give you a hint, this city has banned "happy hour" since […]
- The 10 Best Cities for PAs to Move to in 2025
In its latest ranking of best healthcare jobs, U.S. News and World Report ranked physician assistants as the #2 healthcare job and the #4 best job overall in America.
PAs are undoubtedly in high demand. As of the […]


CASPA Personal Statement Help
 We offer comprehensive, start-to-finish personal statement assistance or help to perfect a draft you already have. We have services to fit every budget.
 Schedule a Live Recorded PA School Video Interview

We offer 60-minute mock PA school interviews with post-interview feedback and advice. Includes a recorded video of your interview that you can watch, download, or share with family and friends. There is no better way to prepare!
Schedule an InterviewPre-PA Consulting and Advising
 Our pre-PA coaching service consists of a 1-hour phone consultation focused on addressing your specific questions or concerns about becoming a PA and applying to PA school.


Leave a Reply