
Physician assistant demographics have changed a lot over the years.
From just four practicing physician assistants in the year 1967 to roughly ~126,000 practicing PAs in 2020. That's a big difference in just over 50 years!
Below is the latest demographic and statistical data on physician assistants from the most recent AAPA Salary report. I have included this cute PA Demographic Infographic that you are free to download and share!
PAs are nationally certified and state licensed to practice medicine and prescribe medication in every medical and surgical specialty and setting in all 50 states, the District of Columbia, U.S. territories, and uniformed services.
We are educated at the graduate level, with all PAs receiving a master’s degree upon graduation from a PA program.
To maintain national certification, PAs are required to complete 100 hours of continuing medical education every two years and to recertify as medical generalists every ten years.
Physician Assistant Facts and Figures
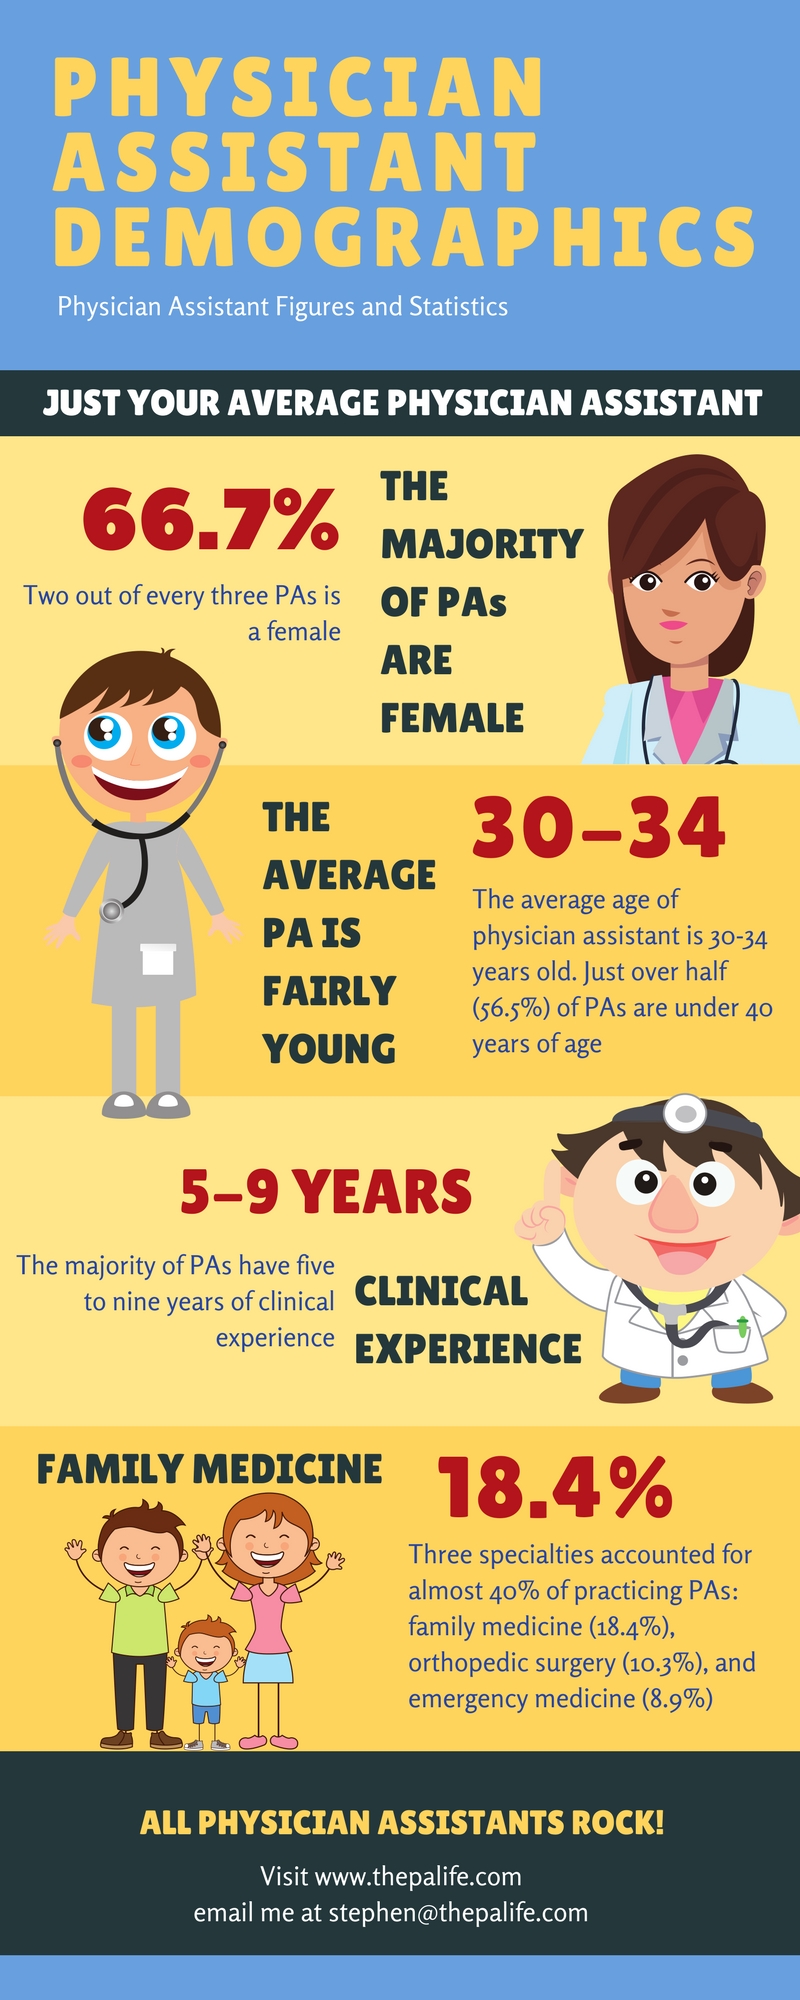
Here is your average physician assistant.
Distribution of PAs by Gender

Two out of every three PAs are female
- Female: 66.2%
- Male: 33.1%
Distribution of PAs by Race

Close to nine in 10 PAs are white and less than one in 10 is Hispanic
- White: 87.3%
- Asian: 4.7%
- Two or More Races: 4.4%
- Black or African American: 3.0%
- American Indian or Alaskan: 0.4%
- Native Hawaiian and other Pacific Islander: 0.2%
Distribution of PAs by Age

The average age of a PA is 30-34 years old. Just over half (56.5%) of PAs are under 40 years of age
- Under 30: 19.2%
- 30-34: 21.7%
- 35-39: 15.6%
- 40-44: 11.2%
- 45-49: 8.7%
- 50-54: 7.9%
- 55-59: 7.3%
- 60-64: 5.6%
- 65 and older: 2.8%
Distribution of PAs by Years of Clinical Experience

The majority of PAs have five to nine years of clinical experience
Reflecting the recent growth in the number of PA programs and new graduates, more than half (55.9%) of PAs have less than ten years experience as a PA
- 0 to 1 year: 13.4%
- 2 to 4 years: 18.7%
- 5 to 9 years: 23.8%
- 10 to 14 years: 15.4%
- 15 to 19 years: 12.5%
- 20 or more years: 16.2%
Distribution of PAs by Most Frequently Practiced Specialty

The majority of PAs still work in family medicine
Three specialties accounted for almost 40% of practicing PAs: family medicine (18.4%), orthopedic surgery (10.3%), and emergency medicine (8.9%)
- Family Medicine: 18.4%
- Surgery: Orthopaedics: 10.3%
- Emergency medicine: 8.9%
- Urgent care: 6.1%
- Other: 5.0%
- Internal medicine: General: 4.3%
- Hospital medicine: 3.8%
- Dermatology: 3.3%
Distribution of PAs Per Capita by State

PAs practice in every U.S. state and territory. While New York has the greatest number of PAs (11,395), Alaska has the highest number of PAs per capita (76.0 per 100,000 population). Most PAs work in urban areas of more than 1 million people. As of 2016, 15.2% of PAs reported working in a rural area.
| State | PAs Per 100,000 |
| Alaska | 76.0 |
| South Dakota | 63.2 |
| Pennsylvania | 60.0 |
| New York | 57.7 |
| Montana | 57.6 |
| Connecticut | 56.4 |
| Idaho | 56.3 |
| Vermont | 55.9 |
| North Carolina | 55.1 |
| Colorado | 54.9 |
| New Hampshire | 54.6 |
| Nebraska | 54.4 |
| West Virginia | 52.1 |
| Michigan | 47.8 |
| Maryland | 45.8 |
| Maine | 43.5 |
| Massachusetts | 43.5 |
| Wyoming | 42.0 |
| North Dakota | 41.8 |
| Utah | 41.8 |
| Wisconsin | 41.8 |
| Minnesota | 39.7 |
| Washington | 38.0 |
| District of Columbia | 37.3 |
| Kansas | 36.8 |
| Arizona | 36.6 |
| Oklahoma | 36.2 |
| Oregon | 36.1 |
| Virginia | 35.8 |
| Florida | 34.9 |
| New Mexico | 34.9 |
| Delaware | 34.7 |
| Iowa | 33.7 |
| Georgia | 33.0 |
| Rhode Island | 31.8 |
| South Carolina | 29.8 |
| Kentucky | 29.3 |
| New Jersey | 29.0 |
| Tennessee | 28.5 |
| Texas | 27.9 |
| Ohio | 26.5 |
| Nevada | 25.7 |
| Illinois | 24.4 |
| Louisiana | 23.2 |
| California | 23.0 |
| Hawaii | 21.8 |
| Indiana | 19.5 |
| Missouri | 16.7 |
| Alabama | 14.9 |
| Arkansas | 12.0 |
| Mississippi | 6.9 |
Distribution of PAs by Urban-Rural Area Status

The majority of PAs work in large, urban areas with more than one million people
- Urban - more than 1 million people: 50.2%
- Urban - 250,000 to 1 million people: 23.9%
- Urban - less than 250,000 people: 10.7%
- Rural - more than 20,000 people adjacent to metro area: 3.7%
- Rural - more than 20,000 people not adjacent to metro area: 1.5%
- Rural - 2,500 to 19,999 people adjacent to metro area: 4.0%
- Rural - 2,500 to 19,999 people not adjacent to metro area: 1.0%
- Rural - less than 2,500 people adjacent to metro area: 2.3%
Media Downloads
Feel free to use these any of these high-quality PNG graphics in your publication with appropriate attribution. You can download a zip file of all the images by clicking here.


Share this Image On Your Site
Copy and paste the raw HTML code below into your site to display this image.
</p><br /><br /> <p><strong>Please include attribution to thepalife.com with this graphic.</strong></p><br /><br /> <p><a href='https://www.thepalife.com/?p=22413&preview=true'><img src='https://www.thepalife.com/wp-content/uploads/2018/01/PHYSICIAN-ASSISTANT-DEMOGRAPHICS-INFOGRAPHIC.jpg' alt='Physician Assistant Demographic Infographic ' width='800px' border='0' /></a></p><br /><br /> <p>
Source: The AAPA Salary Report
You may also like -
 MD Versus PA Showdown Round 1 – Show Me The Money!The net hourly wage of an internal medicine physician is 1.13 times that of a high school teacher and 1.25 times LESS THAN that of a physician assistant! Read more...
- Physician Assistant vs. Nurse Practitioner vs. Medical Doctor
Physician assistant vs. nurse practitioner vs. medical doctor: What's the difference?
All three can evaluate patients, diagnose illness, order tests, develop treatment plans, and prescribe medication, but they reach practice […]
- 10 Best Cities for Physician Assistants in 2026 (Salary vs. Cost)Discover the top 10 cities where physician assistants thrive in 2026! With PA jobs ranked #2 in healthcare and #4 overall by U.S. News, these professionals enjoy median salaries of $130,020+ and 28% projected growth. Find out which cities […]


CASPA Personal Statement Help
 We offer comprehensive, start-to-finish personal statement assistance or help to perfect a draft you already have. We have services to fit every budget.
 Schedule a Live Recorded PA School Video Interview

We offer 60-minute mock PA school interviews with post-interview feedback and advice. Includes a recorded video of your interview that you can watch, download, or share with family and friends. There is no better way to prepare!
Schedule an InterviewPre-PA Consulting and Advising
 Our pre-PA coaching service consists of a 1-hour phone consultation focused on addressing your specific questions or concerns about becoming a PA and applying to PA school.


Insightful stats on the PA profession! It’s great to see the growing impact PAs have in healthcare. Thanks for sharing these valuable trends and data points.
Thank you for the work you do. I recently ran across your site as part of my doctoral studies. This is a wealth of information. I have cited your work in one of my discussion board posts so far and will likely use this resource in future. Keep up the outstanding work.
Al Barber, PA-C
Hello Al,
Thank you so much for your kind words and support! It’s truly heartening to know that the resources on The PA Life are contributing to your doctoral studies. I’m thrilled to be part of your educational journey, and it’s an honor to be cited in your work.
Feel free to reach out if you ever need assistance or have any questions. Together, we continue to foster a compassionate, knowledgeable community that strives to care for everyone.
Keep up your outstanding efforts, too!
Best wishes,
Stephen
Hi Stephen,
I stumbled over this website. I want to let you know how impressed I am at your efforts here as a voice for PAs. I wanted to share some thoughts I have after reading the previous blog. I’ve been a PA since 2002, mostly in the ED. I also have had a private practice for 6 years. I have taken the last 4 years off for family reasons.
I have watched the PA profession change over the years, the profession has gained great respect from the public. With a few exceptions, the Master degree programs have not turned out more advanced PAs which has been frustrating for me because I have sat on many interview panels and ultimately was responsible for training these new hires. Residencies for PAs has been a far better approach.
Interesting to see since I am a woman working in this profession since 1977. When I began there were only 2 other female graduates from my program at Wichita State University in 1977. I began my career in rural Arkansas. Since 1980 have been in California. Have been faculty in 2 PA programs and have a PhD in public health.
Hi Barbara, I agree it is interesting to see, I was having this conversation with a colleague of mine about this very topic the other day. It’s amazing to see how the PA profession has grown and evolved even since I graduated in 2004. Would love it if you would ever be interested in writing a blog post about your time as a PA. I feel like we don’t have enough veteran voices in the blogosphere and it would be great to hear your insights!
Stephen