 Meet Melissa Mean. She is a 38-year-old female physician assistant working in New York State, earning $123,080 per year.
She holds a master's degree in physician assistant studies with a bachelor's of science in biochemistry from Penn State University.
She works 40.3 hours per week in an office-based family medicine practice.
She is not bilingual but speaks just enough Spanish to get by on most days.
Melissa is nationally certified and state-licensed to practice medicine and prescribe medication in every medical and surgical specialty and setting in all 50 states, the District of Columbia, U.S. territories, and uniformed services.
She obtained her PA-C by passing the NCCPA Physician Assistant National Certification Exam (PANCE) and is required to complete 100 hours of continuing medical education every two years to maintain national certification. She will have to recertify as medical generalists every ten years.
Where does the average PAs live?
The top five states ranked by the number of certified PAs are New York (9.7%), California (7.7%), Pennsylvania (6.8%), Texas (6.6% ), and Florida (6.3%)
Certified PAs by State
| State | Number | % of Total (rank) |
| Alabama | 904 | 0.6% (36) |
| Alaska | 618 | 0.4% (41) |
| Arizona | 3042 | 2.2% (17) |
| California | 10,674 | 7.7% (2) |
| Colorado | 3669 | 2.6% (13) |
| Connecticut | 2468 | 1.8 % (20) |
| Delaware | 409 | 0.3% (45) |
| District of Columbia | 265 | 0.2% (50) |
| Florida | 8760 | 6.3% (5) |
| Georgia | 3962 | 2.8% (9) |
| Hawaii | 357 | 0.3% (48) |
| Idaho | 1177 | 0.8% (33) |
| Illinois | 3772 | 2.7% (10) |
| Indiana | 1715 | 1.2% (24) |
| Iowa | 1241 | 0.9% (31) |
| Kansas | 1199 | 0.9% (32) |
| Kentucky | 1487 | 1.1% (27) |
| Louisiana | 1299 | 0.9% (28) |
| Maine | 869 | 0.6% (38) |
| Maryland | 3208 | 2.3% (16) |
| Massachusetts | 3738 | 2.7% (11) |
| Michigan | 5673 | 4.1% (7) |
| Minnesota | 2966 | 2.1% (18) |
| Mississippi | 275 | 0.2% (49) |
| Missouri | 1281 | 0.9% (29) |
| Montana | 717 | 0.5% (40) |
| Nebraska | 1250 | 0.9% (30) |
| Nevada | 988 | 0.7% (35) |
| New Hampshire | 875 | 0.6% (37) |
| New Jersey | 3337 | 2.4% (15) |
| New Mexico | 810 | 0.6% (39) |
| New York | 13526 | 9.7% (1) |
| North Carolina | 6940 | 5.0% (6) |
| North Dakota | 359 | 0.3%(47) |
| Ohio | 4024 | 2.9% (8) |
| Oklahoma | 1622 | 1.2% (25) |
| Oregon | 1988 | 1.4% (22) |
| Pennsylvania | 9464 | 6.8% (3) |
| Rhode Island | 467 | 0.3% (44) |
| South Carolina | 1865 | 1.3% (23) |
| South Dakota | 617 | 0.4% (42) |
| Tennessee | 2323 | 1.7% (21) |
| Texas | 9174 | 6.6% (4) |
| Utah | 1612 | 1.2% (26) |
| Vermont | 392 | 0.3% (46) |
| Virginia | 3696 | 2.7% (12) |
| Washington | 3353 | 2.4% (14) |
| West Virginia | 1015 | 0.7% (34) |
| Wisconsin | 2954 | 2.1% (19) |
| Wyoming | 257 | 0.2% (51) |
| TOTAL | 139,144 | 100% |
| Source: 2019-2020 NCCPA Statistical Profile of Physician Assistants | ||
Is the average PA female or male?
The PA profession continues to be majority female. As of 2020, 69.3% of PAs identify as female.
Number of Certified PAs by Gender
| Gender | Number | Percent |
| Male | 42,888 | 30.7% |
| Female | 96,787 | 69.3% |
| Total | 139,675 | 100% |
| Source: 2019-2020 NCCPA Statistical Profile of Physician Assistants | ||
How old is the average physician assistant?
The median age of certified PAs is 38 years old.
Number of Certified PAs by Age Group
| Age Group | Number | Percent |
| <30 | 24,969 | 17 .9% |
| 30-39 | 53,361 | 38 .2% |
| 40-49 | 32,344 | 23 .2% |
| 50-59 | 17,754 | 12 .7% |
| 60+ | 11,260 | 8 .1% |
| TOTAL | 139,688 | 100 .0% |
| Source: 2019-2020 NCCPA Statistical Profile of Physician Assistants |
||
Distribution of Certified PAs by Age and Gender
What race is the average physician assistant?
The PA profession continues to be majority caucasian. As of 2020, 86.7% of PAs identify as white. The percentage of PAs reporting Asian as their race had increased from 5.4% in 2016 to 6.0% in 2019. All other racial groups have remained steady for the same three-year time period.
Number of Certified PAs by Race
| Race | Number | Percent |
| White | 100,564 | 86.7% |
| Asian | 6,963 | 6.0% |
| Black/African American | 4,136 | 3.6% |
| American Indian or Alaskan Native | 424 | 0.4% |
| Native Hawaiian/Pacific Islander | 347 | 0.3% |
| Other | 3,515 | 3.0% |
| Source: 2019-2020 NCCPA Statistical Profile of Physician Assistants | ||
What degree does the average physician assistants hold?
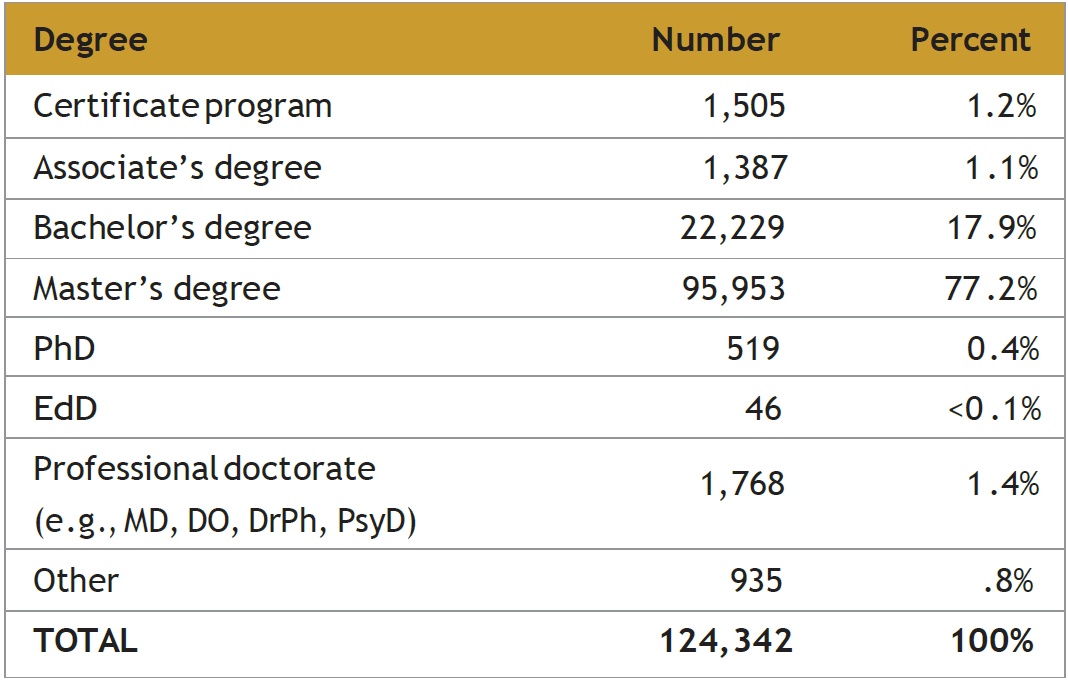
Over time, programs have trended towards the graduate level, and currently, all PA programs must confer a graduate degree to be accredited by ARC-PA. This is evident as the percentage of master’s degrees held by certified PAs has increased from 66.2% in 2013 to 77.2% in 2019.
Number of Certified PAs by Highest Degree Completed

Does the average PA speak another language?
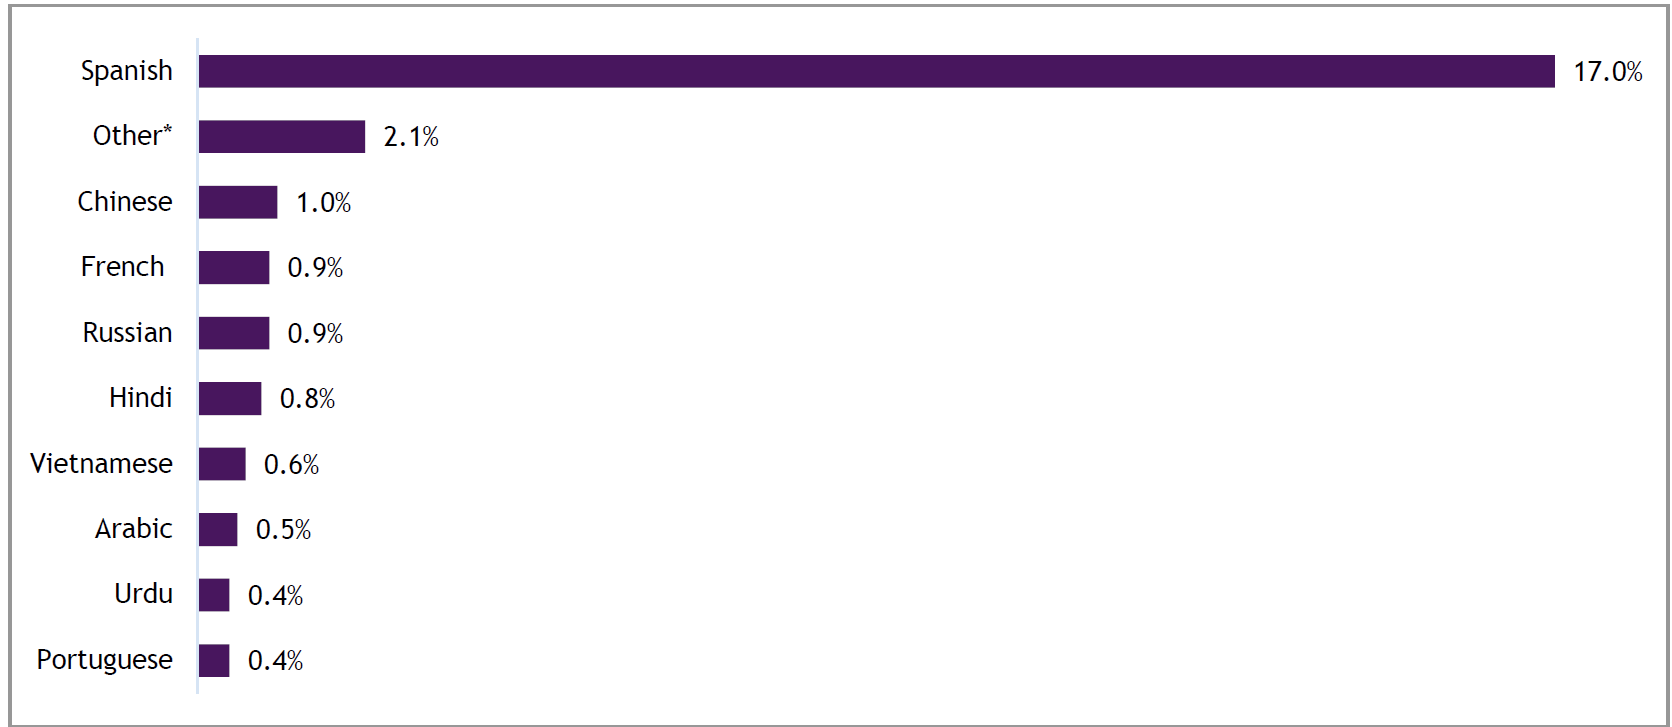
22.8% of Certified PAs communicate with patients in a language other than English. 3. 8 % of Certified PAs speak two or more languages other than English. Of the certified PAs who communicate with patients in a language other than English, most do so in Spanish (17%).
Percent of Certified PAs who Communicate with Patients in Languages Other than English

Does the average PA work in family practice or specialty?
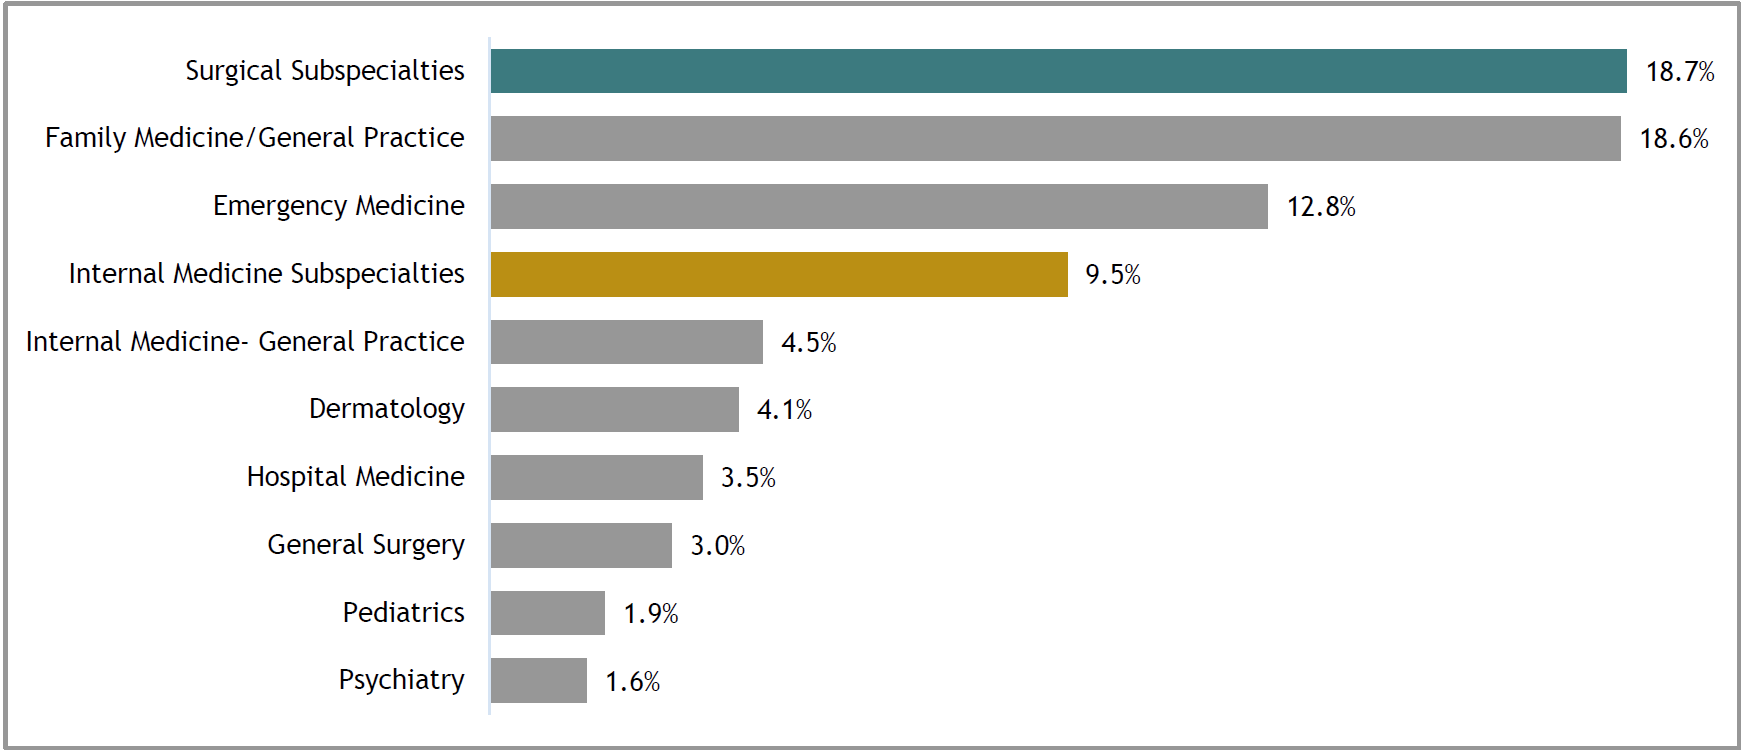
One quarter (25.0%) of certified PAs work in primary care, which includes family medicine/general practice (18.6%), general internal medicine (4.5%), and general pediatrics (1.9%). The remaining three-quarters (75%)of certified PAs work in medical specialties with the largest in percentage in a surgical subspecialty (18.7%), emergency medicine (12.8%), and dermatology (4.1%).
Certified PA Practice Areas

Number and Percent of Certified PAs by Specialty
The percentage of PAs practicing primary care has decreased in the past five years. In 2013, 27.7% of certified PAs reported they worked in a primary care specialty. Alaska is the state with the highest percentage of PAs working in primary care (49.2%), and Ohio has the least (14%). Pain management specialty has seen some of the fastest growth with an increase of 152% since 2016 when it was added to the PA Professional Profile.
| Area of Practice | Number | Percent |
| Addiction Medicine | 391 | 0 .4% |
| Adolescent Medicine | 138 | 0 .1% |
| Anesthesiology | 279 | 0 .3% |
| Critical Care Medicine | 1,682 | 1 .6% |
| Dermatology | 4,269 | 4.10% |
| Emergency Medicine | 13,406 | 12.80% |
| Family Medicine/General Practice | 19,453 | 18 .6% |
| Gynecology | 356 | 0.30% |
| Hospice and Palliative Medicine | 107 | 0 .1% |
| Hospital Medicine | 3,660 | 3 .5% |
| Internal Medicine–General Practice | 4,690 | 4 .5% |
| Internal Medicine–Subspecialty | 9,887 | 9 .5% |
| Neurology | 935 | 0 .9% |
| Obstetrics and Gynecology | 1,193 | 1 .1% |
| Occupational Medicine | 1,457 | 1 .4% |
| Ophthalmology | 80 | 0 .1% |
| Otolaryngology | 999 | 1 .0% |
| Pain Management | 1,438 | 1 .4% |
| Pathology | 7 | < .1% |
| Pediatrics- General Practice | 1,979 | 1.90% |
| Pediatrics– Subspecialties | 1,322 | 1 .3% |
| Physical Medicine/Rehabilitation | 646 | 0.60% |
| Preventive Medicine/Public Health | 128 | 0 .1% |
| Psychiatry | 1,684 | 1 .6% |
| Radiation Oncology | 193 | 0 .2% |
| Radiology | 710 | 0.70% |
| Surgery-General | 3,089 | 3 .0% |
| Surgery– Subspecialties | 19,497 | 18.70% |
| Urology | 1,054 | 1 .0% |
| Other | 9,730 | 9 .3% |
| TOTAL | 104,459 | 100% |
| Source: 2019-2020 NCCPA Statistical Profile of Physician Assistants | ||
How much does the average physician assistants get paid?
According to the NCCPA, the average salary of certified PAs in 2020 is $113,186, and the median salary is $105,000 with the highest-paid to those working in dermatology ($129,246) and critical care medicine ($125,522). The average salary has increased by 15.0% in the last six years. On average, family medicine PAs make $105,286, emergency medicine PAs make $125,110, and an orthopedic surgery PA can expect to make $122,477 in 2020.
The Bureau of Labor Statistics (BLS) reports the median salary for PAs at $112,260, with the top 90% earning $157,120, an increase of just below 4% from the previous year when the median salary for PAs was $108,610.
The latest American Academy of PAs (AAPA) salary report showed an increase in median annual salary for PAs to $107,500. This is an increase from $105,000 compared to the prior year AAPA salary report.
As of Jul 19, 2020, the average annual pay for a physician assistant in the United States, according to data from ZipRecruiter is $107,038 a year. While ZipRecruiter is seeing annual salaries as high as $155,000 and as low as $50,500, the majority of PA salaries currently range between $92,500 (25th percentile) to $117,000 (75th percentile) across the United States.
The 2020 Melnic salary report showed an average PA salary of $115,799. PAs working as PA first assist earned an average salary of $130,000.
PAs working in outpatient care centers earn the highest salaries with a mean of $121,320. New York had the highest number of employed PAs at 13,270, and a mean wage of $123,080. Connecticut had the highest salary for PAs at $137,060. Salinas, California, was the top-paying metropolitan area with an annual salary of $161,370.
Total income in the last calendar year from PA positions (NCCPA)
| Specialty | Salary |
| Addiction Medicine | $113,864 |
| Adolescent Medicine | $91,045 |
| Anesthesiology | $107,421 |
| Critical Care Medicine | $125,522 |
| Dermatology | $129,246 |
| Emergency Medicine | $125,110 |
| Family Medicine/General Practice | $105,286 |
| Gynecology | $98,145 |
| Hospice and Palliative Care | $106,333 |
| Hospital Medicine | $114,356 |
| Internal Medicine | $105,081 |
| Neurology | $104,933 |
| Obstetrics and Gynecology | $99,151 |
| Occupational Medicine | $111,286 |
| Ophthalmology | $100,067 |
| Otolaryngology | $105,913 |
| Pain Management | $111,938 |
| Pathology | $101,667 |
| Pediatrics | $94,526 |
| Physical Medicine/Rehabilitation | $104,150 |
| Public Health | $95,323 |
| Psychiatry | $113,417 |
| Radiation Oncology | $106,848 |
| Radiology | $113,440 |
| General Surgery | $115,427 |
| Surgery– Subspecialty | $122,477 |
| Urology | $109,532 |
| Source: 2019-2020 NCCPA Statistical Profile of Physician Assistants | |


Leave a Reply